
Prometheus and Grafana are two of the most popular open-source monitoring tools for Kubernetes. Prometheus collects and stores metrics data, and Grafana visualizes them in either self designed dashboards or already available ones, shared by the community. Thanks to the broad acceptance of both, in Kubernetes and Helm, it is quite straightforward to integrate additional Helm applications into Prometheus, as well as into your Grafana dashboards.
Introduction
In this guide you will start your journey by deploying Prometheus and Grafana to your cluster in a GitOps fashion, with ArgoCD. You will also spin up Persistent Volumes for both applications to keep your collected metrics dashboards safe. Keep in mind that this article is designed for a self hosted Kubernetes cluster, so if you are playing around in the cloud, you should adjust your Persistent Volume hosting.
Prerequisites
In order to follow along the setup guide, some prerequisites are needed, so better make sure to have them checked before starting the implementation:
- K8S Cluster, preferably self-hosted.
- kubectl
- ArgoCD introduction article
- GitHub repo
Prometheus
Prometheus provides monitoring and real-time alerting for container orchestration platforms like Kubernetes. It collects and stores the metrics as time series data. It has an out-of-box capability for monitoring, and it acts as a data source for Grafana.
Start with creating a folder where you will store all files related to Prometheus.
mkdir prometheus
cd prometheusPersistent Volume
As you want to keep the collected data of Prometheus even if you delete it for some reason, you need to add a persistent volume. Define therefore a manifest, called prometheus_pv.yaml with a local volume and size of 1 GB:
apiVersion: v1
kind: PersistentVolume
metadata:
  name: prometheus-pv
  labels:
    app: prometheus
spec:
  capacity:
    storage: 1Gi
  volumeMode: Filesystem
  accessModes:
  - ReadWriteOnce
  persistentVolumeReclaimPolicy: Retain
  storageClassName: local-storage
  local:
    path: /prometheus-data
  nodeAffinity:
    required:
      nodeSelectorTerms:
      - matchExpressions:
        - key: kubernetes.io/hostname
          operator: In
          values:
- <your-node-hostname>Make sure to replace spec.nodeAffinity.required.nodeSelectorTerms.matchExpressions.values with your desired node hostname. You can look it up with:
kubectl get nodes -o wideAs that example is defining a local storage, it can’t be moved between nodes like network storage. That’s why you need to assign it to one node.
Before deploying your volume and bringing it to life, make sure that the defined path defined in the manifest exists and has the appropriate access permissions. At a Unix Ubuntu machine, and a K3S cluster, execute the following. If you are on a different OS or Kubernetes architecture, just use some classical online lookup, or nowadays some help of AI, to adjust the commands:
sudo mkdir -p /var/lib/rancher/k3s/storage/prometheus-data
# Set ownership to the Prometheus user (UID 65534)
sudo chown 65534:65534 /var/lib/rancher/k3s/storage/prometheus-data
# Set proper permissions
sudo chmod 755 /var/lib/rancher/k3s/storage/prometheus-data
# Verify the directory is set up correctly
ls -la /var/lib/rancher/k3s/storage/prometheus-dataThen go ahead and deploy the volume:
kubectl apply -f prometheus-pv.yamlPrometheus Configuration
Your volume should be ready to use. You will need to link the volume to Prometheus. That will be done through a Persistent Volume Claim, you can use the Prometheus values file to configure one and claim the volume. So create a values.yaml file and add the following to it:
  persistentVolume:
    enabled: true
    statefulSetNameOverride: ""
    accessModes:
    - ReadWriteOnce

    labels: {}
    annotations: {}
    mountPath: /data
    size: 1Gi
    storageClass: "local-storage"
    volumeName: "prometheus-pv"
    selector:
      matchLabels:
app: prometheusGitOps Application
As you will let ArgoCD manage your application, you have to create an Application manifest instead of manually deploying it. Create a file called argocd_prometheus.yaml for that and insert the following manifest into it:
apiVersion: argoproj.io/v1alpha1
kind: Application
metadata:
  name: prometheus
  namespace: argocd
  finalizers:
  - resources-finalizer.argocd.argoproj.io
spec:
  project: default
  sources:
  - repoURL: https://prometheus-community.github.io/helm-charts
    chart: prometheus
    targetRevision: 27.23.0
    helm:
      valueFiles:
      - $values/prometheus/values.yaml # adjust the path to your values file if needed
  - repoURL: git@github.com:<GitHub_user_account>/<GitHub_repository_name>.git # replace it with your GitHub repo address
    targetRevision: main
    ref: values
  destination:
    server: https://kubernetes.default.svc
    namespace: monitoring
  syncPolicy:
    automated:
      prune: true
      selfHeal: true
    syncOptions:
- CreateNamespace=trueGrafana
Grafana is a multi-platform, open-source online application for analytics and interactive visualization. When you connect it to supported data sources like Prometheus, you can get:
- Interactive Dashboards.
- Interactive charts.
- Graphs.
- Alerts for the web.
Grafana enables you to query, visualize and comprehend your metrics regardless of the data source. Besides Prometheus, Grafana supports several other data sources such as: - InfluxDB
- AzureMonitor
- Datadog
- Graphite
- AWS CloudWatch
- PostgreSQL
- Microsoft SQL Server (MSSQL)
- Elasticsearch
- Google Cloud Monitoring
- Azure Monitor
- MySQL
- Alertmanager
- Loki
You have the option of creating your dashboards from scratch. You can also import those that Grafana already offers and customize them to meet your needs. Most DevOps professionals use Grafana and Prometheus to create a powerful time-series database with data visualization dashboards.
We will separate both application configurations, so create a new folder where you will store all Grafna related configuration files:
cd ..
mkdir grafana
cd grafanaPersistent Volume
Create a file called grafana_pv.yaml for Grafana’s persistent volume and insert the following configuration code:
apiVersion: v1
kind: PersistentVolume
metadata:
  name: grafana-pv
  labels:
    app: grafana
spec:
  capacity:
    storage: 1Gi
  volumeMode: Filesystem
  accessModes:
  - ReadWriteOnce
  persistentVolumeReclaimPolicy: Retain
  storageClassName: local-storage
  local:
    path: /grafana-data
  nodeAffinity:
    required:
      nodeSelectorTerms:
      - matchExpressions:
        - key: kubernetes.io/hostname
          operator: In
          values:
- <your-node-hostname>Make again sure that you have the assigned path exists on your machine:
sudo mkdir -p /var/lib/rancher/k3s/storage/grafana-data
# Set ownership to the Prometheus user (UID 65534)
sudo chown 65534:65534 /var/lib/rancher/k3s/storage/grafana-data
# Set proper permissions
sudo chmod 755 /var/lib/rancher/k3s/storage/grafana-data
# Verify the directory is set up correctly
ls -la /var/lib/rancher/k3s/storage/grafana-dataDeploy the persistent volume with the following command:
kubectl apply -f grafana-pv.yamlGrafana Configuration
And go ahead with the Grafana values file:
admin:
  ## Name of the secret. Can be templated.
  existingSecret: "grafana"
  userKey: admin-user
  passwordKey: admin-password

ingress:
  enabled: true
  ingressClassName: nginx
  annotations:
    kubernetes.io/ingress.class: nginx
    cert-manager.io/cluster-issuer: letsencrypt-nginx
  labels: {}
  path: /

  pathType: Prefix
  hosts:
  - <your-domain-for-exposing-grafana>
  extraPaths: []

  tls:
  - secretName: grafana-server-tls
    hosts:
    - <your-domain-for-exposing-grafana>

persistence:
  type: pvc
  enabled: true
  storageClassName: "local-storage"
  volumeName: "grafana-pv"
  accessModes:
  - ReadWriteOnce
  size: 1Gi
  finalizers:
  - kubernetes.io/pvc-protection
  selector:
    matchLabels:
app: grafanaAs you will want to expose Grafana, you have to add an Ingress configuration to it. Adjust the domains for http and https for it! You will also need some login credentials for it. So create a secret with your desired user name and password:
kubectl create secret generic grafana -n monitoring
--from-literal=admin-user=<your-username>
--from-literal=admin-password=<your-secure-password>GitOps Application
Create the ArgoCD application manifest called argocd_grafana.yaml for Grafana:
apiVersion: argoproj.io/v1alpha1
kind: Application
metadata:
  name: grafana
  namespace: argocd
  finalizers:
  - resources-finalizer.argocd.argoproj.io
spec:
  project: default
  sources:
  - repoURL: https://grafana.github.io/helm-charts
    chart: grafana
    targetRevision: 9.2.9
    helm:
      valueFiles:
      - $values/grafana/values.yaml # adjust the path to your values file if needed
  - repoURL: git@github.com:<GitHub_user_account>/<GitHub_repository_name>.git # replace it with your GitHub repo address
    targetRevision: main
    ref: values
  destination:
    server: https://kubernetes.default.svc
    namespace: monitoring
  syncPolicy:
    automated:
      prune: true
      selfHeal: true
    syncOptions:
- CreateNamespace=trueApp in Apps Manager
To streamline the deployment and management of both Prometheus and Grafana through a single ArgoCD application, you can create an “App of Apps” pattern. This approach allows you to manage multiple related applications as a unified monitoring stack, making it easier to deploy, sync, and maintain your entire monitoring infrastructure with a single ArgoCD application. Create therefore a new file called argocd_monitoring_manager.yaml in the root directory.
cd ..
touch argocd_monitoring_manager.yamlThen insert and adjust the following manifest:
apiVersion: argoproj.io/v1alpha1
kind: Application
metadata:
  name: monitoring-manager
  namespace: argocd
spec:
  project: default
  sources:
  - repoURL: 'git@github.com:<GitHub_user_account>/<GitHub_repository_name>.git'
    targetRevision: main
    path: prometheus
  - repoURL: 'git@github.com:<GitHub_user_account>/<GitHub_repository_name>.git'
    targetRevision: main
    path: grafana
  destination:
    server: https://kubernetes.default.svc
    namespace: argocd
  syncPolicy:
    automated:
      prune: true
      selfHeal: true
    syncOptions:
- CreateNamespace=trueAdjust your GitHub repository address in here again.
Make sure to have a file structure, like the following example below. That is important to align with the ArgoCD Application manifests.
.
├── argocd_monitoring_manager.yaml
├── grafana
│   ├── argocd_grafana.yaml
│   ├── pv_grafana.yaml
│   └── values.yaml
├── prometheus
│   ├── argocd_prometheus.yaml
│   ├── prometheus-pv.yaml
│ └── values.yamlIf everything is in place, go ahead and push everything to your GitHub repository:
git add .
git commit -m "init"
git push origin mainAnd finally deploy both applications with the command, referring to the app in apps manager manifest:
kubectl apply -f argocd_monitoring_manager.yamlWait a bit till everything got deployed. Check the status, it should look like this:
kubectl get services -n monitoringNAME TYPE CLUSTER-IP EXTERNAL-IP PORT(S) AGE
grafana ClusterIP 10.43.157.92 <none> 80/TCP 12m
prometheus-alertmanager ClusterIP 10.43.88.201 <none> 9093/TCP 8m
prometheus-alertmanager-headless ClusterIP None <none> 9093/TCP 8m
prometheus-kube-state-metrics ClusterIP 10.43.203.14 <none> 8080/TCP 8m
prometheus-prometheus-node-exporter ClusterIP 10.43.96.175 <none> 9100/TCP 8m
prometheus-prometheus-pushgateway ClusterIP 10.43.42.138 <none> 9091/TCP 8m
prometheus-server ClusterIP 10.43.219.67 <none> 80/TCP 8mDashboard Setup
You are ready to create your first dashboard now. So open up your domain where you exposed Grafana and login with your credentials, you defined in the secret. In case you forgot them, here is the command to get them:
kubectl get secret --namespace monitoring grafana -o jsonpath="{.data.admin-user}" | base64 --decode; echo &&
kubectl get secret --namespace monitoring grafana -o jsonpath="{.data.admin-password}" | base64 --decode; echoAt the sidebar, navigate to Connections and Add new connection. Then search for Prometheus, insert your internal Prometheus url, which should be by default the following:
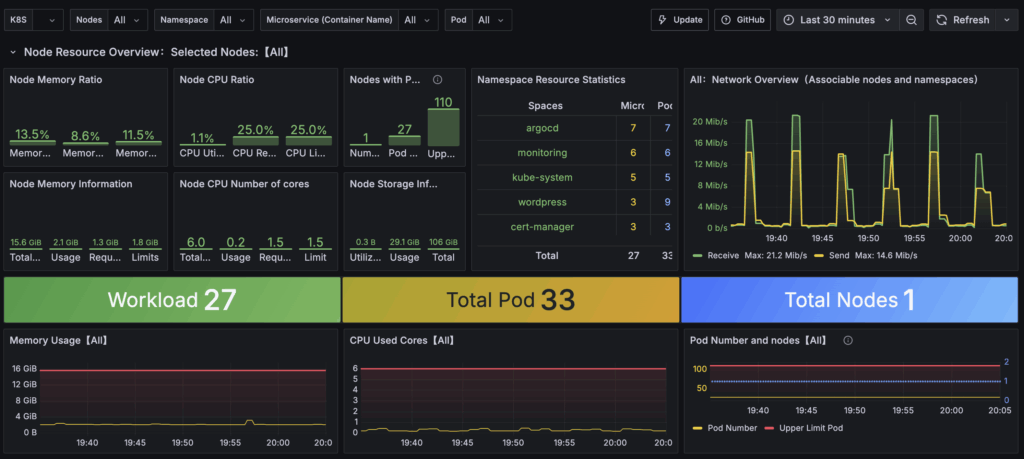
http://prometheus-server.monitoring.svc.cluster.local:80and submit it with the button ”Add new source”. Now go to: https://grafana.com/grafana/dashboards/ and search for a dashboard. For example, lookup the dashboard called “K8S Dashboard” and copy to ID, which should be: 15661. Then go back to your hosted Grafana and
- Navigate to the Dashboard section on the left sidebar.
- Click on the new -> import.
- Add the Grafana ID, and click on ‘Load’.
- Select a Prometheus Data Source and Click
Import!
Conclusion
You have now:
- Provisioned Prometheus and Grafana via a fully declarative GitOps workflow (ArgoCD Applications plus an App-of-Apps manager).
- Attached persistent local storage so data and dashboards survive pod restarts or chart upgrades.
- Secured initial access to Grafana with a Kubernetes Secret-driven admin user.
- Exposed Grafana through an Ingress (ready for TLS via cert-manager) and connected it to Prometheus as a data source.
This foundation gives you continuous, version-controlled observability. Any change (chart version bumps, value tweaks, additional dashboards) becomes a Git commit rather than a one-off kubectl command.